Business Process Mapping is a technique to visually represent the steps and activities involved in a process, such as a flowchart or a diagram. It helps to communicate how a process works, identify inefficiencies or areas of improvement, and coordinate the responsibilities of different team members or stakeholders. Business Process Mapping is part of Business Process Management (BPM), which is a discipline that aims to optimize the performance and outcomes of business processes.
ome of the benefits of Business Process Mapping are:
– It provides a clear and concise overview of the process, making it easier to understand and follow.
– It reveals the dependencies, inputs, outputs, and resources of each step, enabling better planning and execution.
– It facilitates collaboration and communication among the participants of the process, as well as with external parties such as customers or regulators.
– It supports process analysis, documentation, training, integration, and improvement, leading to higher quality, efficiency, and customer satisfaction.
To create a Business Process Map, you need to:
– Identify the process you want to map and its scope, purpose, and objectives.
– List the activities, tasks, and decisions involved in the process, as well as the roles and responsibilities of each actor.
– Arrange the activities in a logical sequence, using symbols and connectors to represent the flow and the relationships among the elements.
– Validate and verify the accuracy and completeness of the map, by testing it against real scenarios and getting feedback from the stakeholders.
– Implement and monitor the process, and update the map as needed to reflect any changes or improvements.
There are different types of Business Process Maps, depending on the level of detail and complexity of the process. Some of the common ones are:
– SIPOC Diagram: A high-level map that shows the Suppliers, Inputs, Process, Outputs, and Customers of a process.
– Value Stream Map: A map that shows the value-added and non-value-added activities of a process, as well as the time, cost, and quality metrics associated with each step.
– Swimlane Diagram: A map that shows the process flow across different departments, roles, or functions, using horizontal or vertical lanes to separate the responsibilities.
– Business Process Model and Notation (BPMN): A standard notation for modeling and documenting business processes, using a set of graphical symbols and rules to represent the elements and the flow of a process.
If you want to learn more about Business Process Mapping, you can check out these resources:
– [Essential Guide to Business Process Mapping | Smartsheet](^1^)
– [Guide to process mapping: Definition, how-to, and tips – Asana](^2^)


 CDSTEP Marketing Diagram
  People process technology framework ppt examples slides powerpoint
  GE McKinsey Nine Box Matrix
  End to End Process
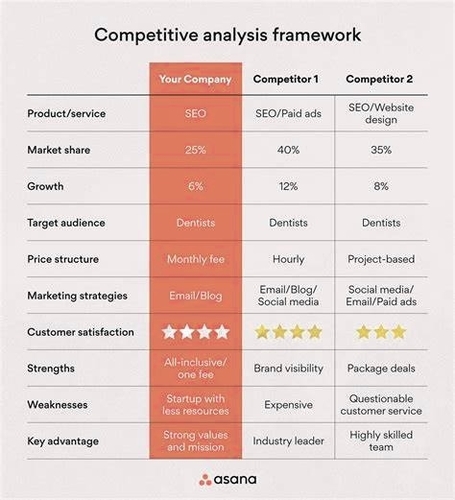
  Competitive Analysis Table
  Business Heat Map
  Thematic Analysis Framework
  Blockchain Structure 26
  Gap Analysis Current vs Future State
  Affinity Diagram
  Ecommerce Process Flow
  Stanford Design Thinking Process
  Business Strategy Infographic
  Software project management context diagram
  Value Stream Map